Next Step: Spectral Analysis?
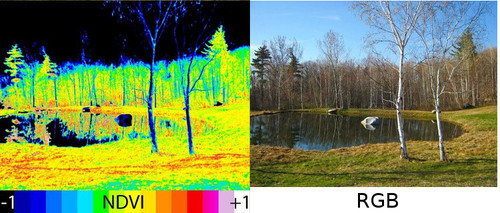
Spectral analysis—it’s not just for NASA anymore. With Infragram, the people over at Public Lab have done something amazing. They’ve figured out a way that anyone can use near-infrared photography to determine the health of plants. The science behind it is well explained here, but the short explanation is that chlorophyll in plants absorb blue and red light during photosynthesis (but not green—green light is reflected, and that’s what we see—or infrared light). What Infragram allows you to do is upload an image from a camera with an infrared filter, and it analyzes the photo to show you where the healthy plants are (see image above—NDVI stands for “normalized difference vegetation index”). Again, that’s not the whole story of what’s going on here, but you get the idea.
Now, you may ask, where does one get an infrared camera? Check out the Pi NoIR, a $30 infrared camera that attaches to a Raspberry Pi. Order from Adafruit and they also include the blue plastic filter for capturing images for Infragram. (Although we are not quite sure how to attach the filter to the camera—do you just tape it over the lens?) So imagine this: In addition to monitoring soil moisture and temperature, students can use the Root Kit to take photos of their rain garden, for example, upload it to Infragram and actually see photosynthesis (or evidence of it, at least). That seems … futuristic.
Lots of interesting stuff is happening with the Raspberry Pi and cameras. One of our favorite things is Upstagram, wherein some hackers put a Raspberry Pi and a camera inside a tiny house attached to helium balloons (like in the movie Up) and floated it over Paris to get a bird’s eye view of the city. Check it out: