26 Apr

Philly Tech Week 2013

20130425_inq_gelles25-b
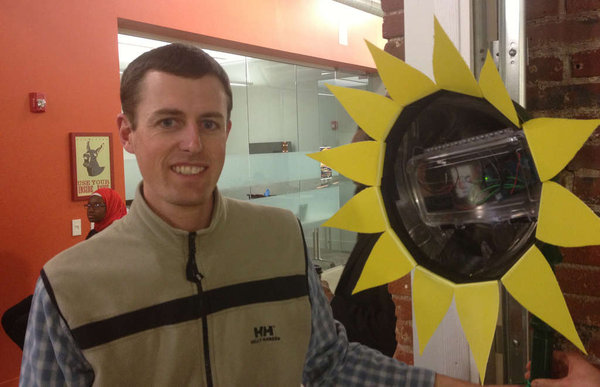
Image: Philadelphia Inquirer

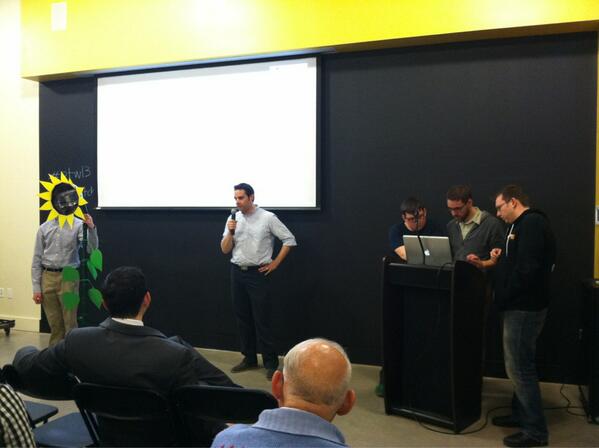
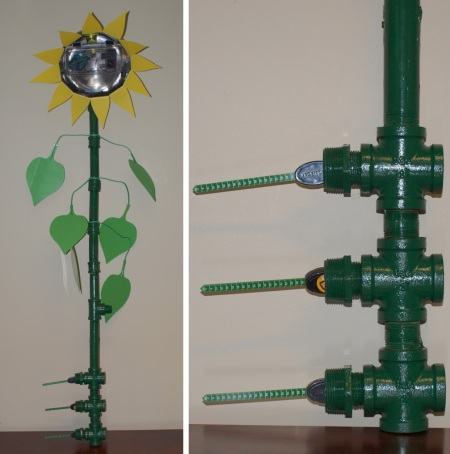
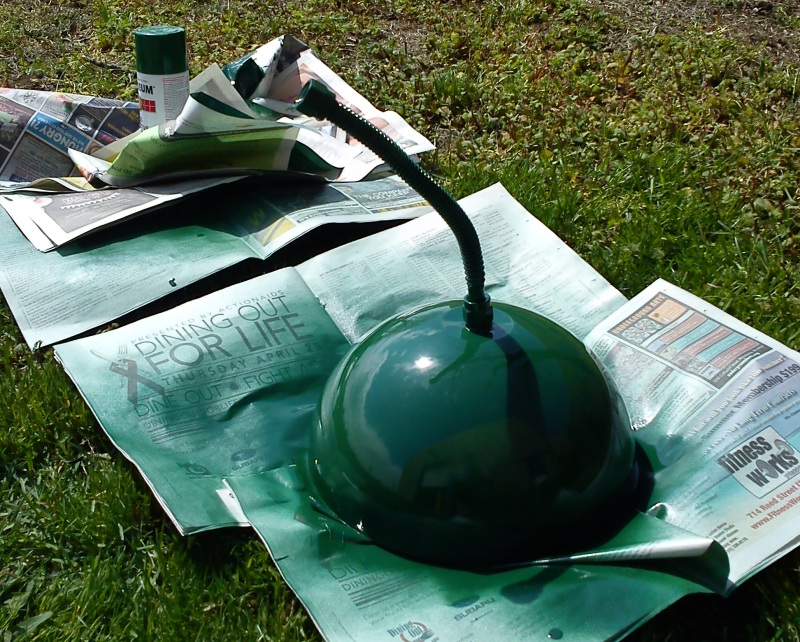
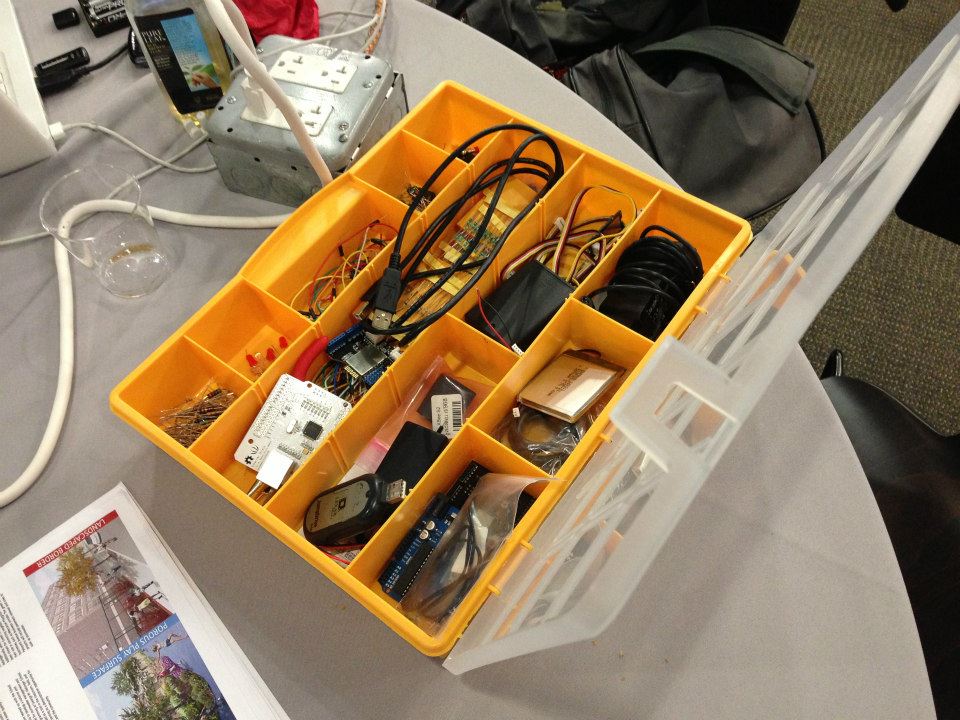
That’s my co-worker, PWD engineer Chris Bergerson, at the Switch Philly event this week. He got his picture in the newspaper because he happened to be standing near the sunflower at some point. Nice job, Chris. (But for real, thanks to Chris and Tommy Thompson for helping out.) This photo shows the head of the sunflower a little bit better—the Arduino and battery pack are inside a waterproof plastic snap case, with a hole drilled in the back for the sensor wires. We didn’t put a covering over the electronics, because we wanted them to be visible for now. (It also makes it easier to access.)

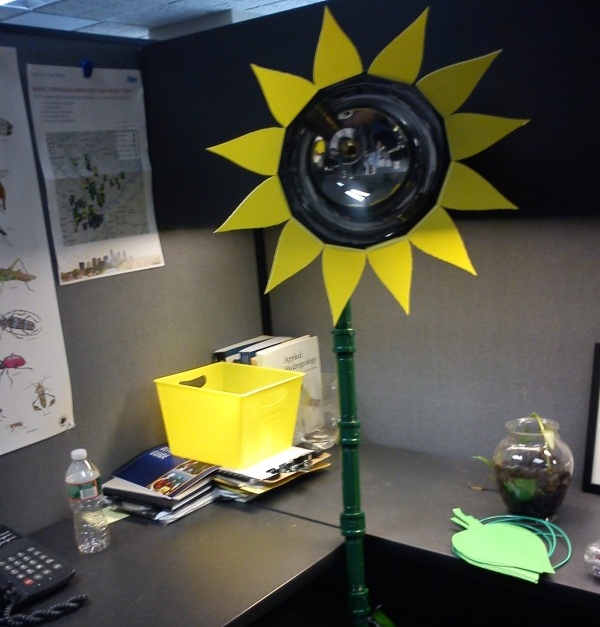
Chris Nies, Kevin Clough, Jason Blanchard and I did a five-minute presentation and complete demo of the Solar Sunflower. We put the sunflower in a bucket of soil, poured some water into the bucket, and watched (apprehensively—soil moisture is not the most dynamic thing in the world) as the website updated data values in real time. A total success, and we took second place in the competition. Congratulations to the winning team (Temple MESA), a group of students who devised a tutoring application. Here’s some more coverage on Technically Philly.

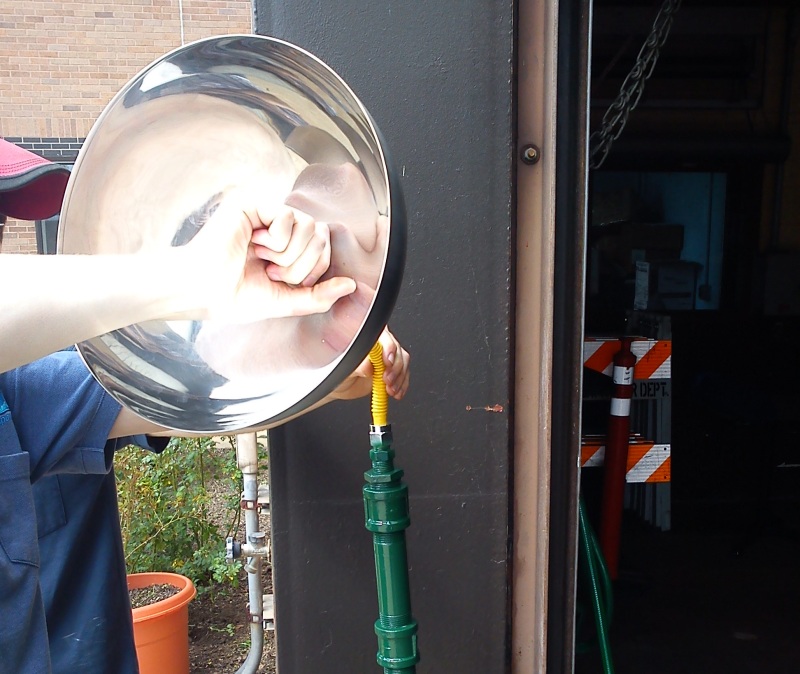
Here we are at Switch Philly, with the sunflower doing a total eclipse of Tommy’s head.

PhillyTechWeek

19 Apr

Solar Sunflower Comes Alive!

OLYMPUS DIGITAL CAMERA

It’s alive!

It’s not really alive. But it has been built—just in time for next week’s demo at Philly Tech Week. The sunflower was built with the generous assistance of PWD aquatic biologist Jay Cruz and Drexel University student Tommy Thompson, who’s currently a co-op with our Watershed Sciences group. It’s heavy; it’s mostly made from repurposed metal pipes we had lying around in a PWD garage. We originally thought it might be made of PVC, but we already had the pipe, and PVC is difficult to paint (it requires roughing up the surface so the paint sticks). Let’s have a look at the construction:

sunflower_construction

Pipe sections and pipe fittings were assembled, with three cross fittings on the bottom for the three soil moisture sensors. The yellow cable at the top is a flexible gas hose from Home Depot, the kind that attaches to the back of a gas stove.

sunflower_roots

A closer look at the “roots.” The wires from the sensors thread up through the pipe/”stem.”

sunflower_drill

The head of the sunflower is a cheap mixing bowl from IKEA, drilled through the center to attach it to the flexible gas hose.

sunflower_head

A threaded gas connector holds the head in place. The tubing is a little too flexible; the head droops a bit but it can easily be stabilized with some rigid wire (like a length of coat hanger) or a pipe section around the hose that acts as a sleeve.

sunflower_paint

A quick spray paint of the head and flexible gas hose.

sunflower_petals

Found some yellow and green plastic containers at the dollar store; cut out petals and leaves from stencils; did battle with a hot glue gun. Arts and crafts is not our strong suit, but it’s presentable enough. Here’s the sunflower in my cubicle, freaking people out.

12 Apr

Web Display Mockup

phillywatersheds_screenshot

Here’s a quick mockup of a web page displaying data from the Solar Sunflower—none of this represents real data. It helps to visualize what the end product looks like, where the site lives (this presents it as a page on phillywatersheds.org, a Philadelphia Water Department website), and what features we want. Let’s break down what we’ve got so far:

  • A multi-line graph that’s updated in real time with soil moisture sensor values. Three data series, three soil moisture sensors. This sample image was generated using Javascript D3, a really powerful graphing library.
  • A “water me!” graphic. This could be something as simple as an image swap; when the soil sensors read below some threshold value for moisture, a raindrop appears. When the value is above the threshold, a green leaf is shown.
  • A map of locations of all the sensors. Although we’re only dealing with two sites at the moment (Greenfield and Nebinger Elementary schools), hopefully there will be a growing network of schools involved. By encoding latitude and longitude of each school, we can click on a point on the map and call up that school’s current data.
  • And finally, downloadable text or Excel files of the data. This doesn’t sound too exciting, but I think it’s where the in-depth educational value lies. Creating plots, correlating data, identifying trends, and analyzing statistics all rely on access to this raw data.
10 Apr

AT&T EduTech Hackathon

edutech_hackathon
Image: Technically Philly

This weekend, the Solar Sunflower project was selected as one of 5 finalists to advance to the Switch Philly event on April 23 and compete for a $5,000 prize. The field was narrowed down at the AT&T EduTech hackathon at Temple University on Saturday. Like TechCamp, the hackathon (organized by AT&T, Jarvus, Technically Philly and Temple’s Urban Apps and Maps Studio) focused on using technology to improve education. Some of the other projects included a mobile app that helps students find the safest walking route to school; a game app that uses a fantasy-football approach to tracking learning progress; and an app that connects students with tutors.

Not all our team was there, but Chris Nies and I were able to present a working demo of real-time sensor data being posted to the web in front of an audience and a panel of judges. It sounds pretty rosy in hindsight, but to be honest we spent hours just trying to send data via Temple’s WiFi network; these things happen. Thanks to Jarvus’ Chris Alfano and Technically Philly’s Brian James Kirk for their support and encouragement.

Here’s Technically Philly’s coverage of the event. We stole their photo of our box of Arduino stuff, above.