28 Jun

Epic Power Fail

Nebinger_plot_June_19

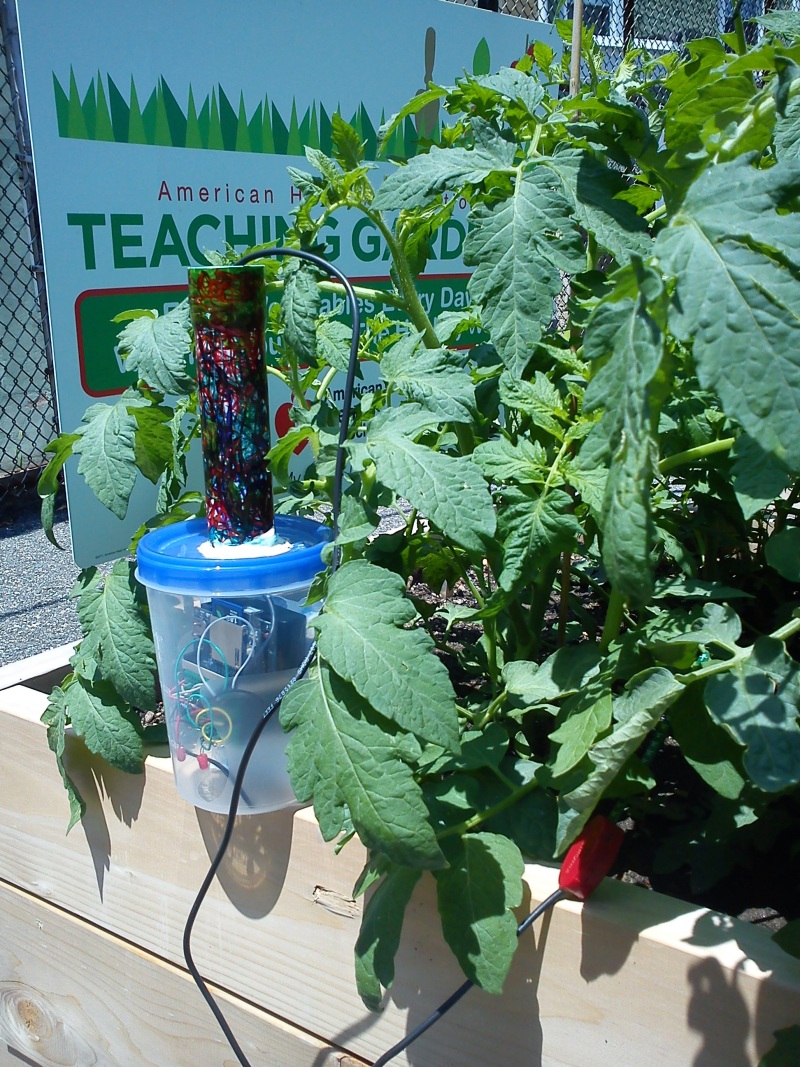
Went back to Nebinger Elementary to check on the snake sensor described in the previous post, and … the batteries were dead. We got about three days’ worth of good data (see chart, above), taking soil moisture and temperature readings every 30 minutes. There was no rain during that period, but it’s clear from the chart when volunteer gardeners went out and watered the vegetable garden—the temperature (blue line) dips as the cold water contacts the temperature sensor, and the soil moisture (red line) increases. (The sensors were not calibrated, by the way, so pay no attention to the numbers on the soil moisture axis; the volumetric water content would not be at all accurate.)

What happened? The Arduino was programmed to go to sleep between sensor readings, using the functions in the Narcoleptic library. The LEDs and sensors shouldn’t be drawing much from the batteries. There were some hot days in that stretch, but it’s cold weather you have to worry about when considering temperature effects on battery drain. Something else is going on.

Here’s where we dusted off the multimeter and made a somewhat surprising discovery. After wiring a circuit to measure current draw, we saw that the Arduino Uno was drawing around 50 mA (milliamps), even while it was idle in sleep mode. I’m no electrical engineer, and this is probably some fuzzy math I’m about to do, but let’s say a AA battery has 2000 mAh (milliamp hours), and the four AAs are wired in series, so current is not additive. (Read this if I just lost you.) So 2000 mAh divided by 50 mA—we can expect about 40 hours of operation; a little less than 3 days. That’s just about what we got with the snake sensor.

Clearly we need a better approach to conserve battery life—a different circuit, a way to minimize the current draw by eliminating the Arduino’s “on” LED or voltage regulator, maybe even look at different microcontroller boards that don’t consume as much power.

19 Jun

Snakes on a Playground

Snake_Sensor_partsThis summer, the playground at Nebinger Elementary School in Bella Vista will lose some impermeable asphalt and gain a rain garden and some porous play surface. It’s all part of a plan to capture stormwater and protect our rivers and streams. But after construction is finished and the vegetation is planted, students may not even realize the function of the system in place.

Thanks to an engaged principal, faculty and educators from the Fairmount Water Works Interpretive Center, however, students are already learning about water-related issues and getting ready for a greener play area (the school already has a very productive vegetable garden in raised planter beds). When teacher Rachel Odoroff was looking for a year-end project for her 7th and 8th grade science classes, we saw an opportunity to introduce some of our work with sensors into the classroom.

The challenge: In two days, work with the students to design and install some sensors to monitor the vegetable garden.

The plan: Well, it’s a bit too ambitious to try to access the school’s WiFi network and get the Solar Sunflower server to display the data, so we decided to make a datalogger to record soil moisture and temperature in the garden. We gave the students a short introduction to the electronics, and they got started with designing the housing. The result? A snake made out of a tupperware container for the head, and pieces of flexible plastic plumbing connectors (the kind you might use to connect pipes under your sink).

Below is the “head” of the snake: an Arduino, an SD card shield (data is written to an SD card, like the memory card in your phone or camera), a battery pack with 4 AAs, and red LED “eyes” that light up when the soil is too dry. The temperature sensor is a black wire that protrudes from the front of the head, like a tongue.

Snake_Sensor_head_sm

Here is the head of the snake in the garden, placed among some tomato plants:

Snake_Sensor_Installed_sm

The tail of the snake—the soil moisture sensor‘s wire threads through the tubing and the sensor is buried about four inches in the ground:

Snake_Sensor_tail_sm

Unfortunately the end of school means the students won’t have an opportunity to examine much of the data, but we’ll be back during the summer to check on the snake every once in a while. We hope to build on this project next year—add wireless communication, upload data to the web in real time, add a light display—and extend it to monitor the rain garden. Thanks to Ms. Odoroff, her students, Drexel co-op Tommy Thompson, and Fairmount Water Works education and outreach coordinator Ellen Schultz for making this project happen. Thanks to PWD engineer Stephen White for coming up with the phrase “snakes on a playground.”

12 Jun

Lies We Told About Solar Power

usbdcsolarchargeruse_MED

It’s time to come clean about the “solar” part of the Solar Sunflower—it isn’t happening right now. As it stands, a 9-volt battery powers the Arduino inside the sunflower’s head. There are practical reasons why the solar portion of the project is still under development: It isn’t convenient to rely on solar power when doing an indoor demonstration, and the sunflower design would likely place the solar panel over the top of the electronics in the head, making it difficult to disassemble when needed.

But mostly, we need to do a lot more legwork and research. Adafruit sells the components to make a solar charger that powers a Lithium ion battery (pictured above) and has a terrific tutorial on how to assemble it. Will it provide enough power for the Arduino WiFi shield, which operates at 5 volts? Will it be reliable, especially at low light levels during a storm? I assembled the solar charger at home and used it to charge my cell phone:

solarcharger

Only in direct sunlight did I get the voltage needed to charge the phone. It’s worth testing with the sunflower setup, but more research is needed across the board with regard to powering the sensors. We’ll do that right after I clean my windowsill.

07 Jun

Show Me The Code

arduino_codesample

At this point, we have a working version of the Solar Sunflower: An Arduino equipped with a WiFi shield sends sensor data to a server. Some of you might be wondering where the code is. The short answer is that it’s at our GitHub repository (more on this shortly). There you can find the Arduino code (a screenshot of it is posted above), the Ruby code for the server, and documentation and revision history. We’ll definitely be discussing the project’s technical issues in this blog, but it isn’t meant to be a documentation of our code. The code is going to change many times over the course of this project, and it isn’t always interesting or productive to list every little change here. Go to GitHub.

If you’re not familiar with GitHub, here’s what we wrote in the FAQ section:

GitHub is a website that hosts files for tech development projects. It’s kind of like Google docs for programmers. GitHub allows multiple people to work on code separately, then merge the changes back into one file.  Groups of files (for a certain project, for example) are collected in one location called a repository.